How shapes shape our understanding of probability.
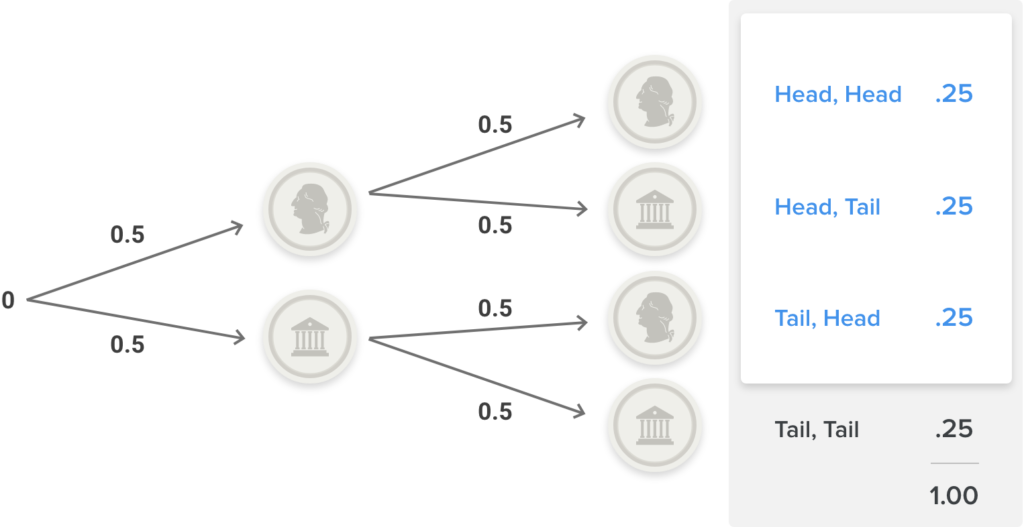
What chances are worth taking? Two main factors, risk and reward, help us find the answer, but another important component exists: probability. Probability measures chance and is typically calculated by dividing the number of outcomes that satisfy a given parameter by the total number of possible outcomes (1). Probability is commonly used to determine the likelihood of receiving heads or tails when flipping a coin. Assuming that a fair coin is used, the flipper has a 50 percent chance of getting heads and 50 percent of flipping tails on each flip. We can further complicate this problem by adding a more situational question: What if we flip the coin multiple times? Considering two coins, our focus moves towards the ways to achieve a desired scenario. Looking at the possibilities, we can get HH, HT, TH, TT where H represents heads and T represents tails. To calculate a probability for flipping two tails, we must count the ways to flip two tails in a row and divide the answer by the number of total outcomes. In the situation above, this occurs one out of four times, or 25 percent of the time (See Figure 1).

Unfortunately, probability is not always so easy to calculate. Some situations make it impossible to give a definite value to the number of select outcomes or the number of total outcomes. For example, it is impossible to literally count the probability of something happening for all real numbers between 0 and 1 because an infinite number of real numbers, including 0.100001, lies between the two values. Finding how many numbers between 0 and 1 are less than 0.15 may seem intuitive, leading to an answer of 15 percent, but not all problems can be solved so simply. To solve some problems where probabilities are harder to directly count, for example those that involve real numbers on intervals, we can model a situation using geometry. Let’s take an example:
You and your friend are going to watch a baseball game. You each take different buses that lead to the stadium. Unfortunately, neither of you want to spend too long waiting for the other outside the stadium. Therefore, you both agree to wait at most 10 minutes for the other before entering the stadium. If your buses arrive at a random time between 5:00 pm and 6:00 pm, what is the probability you enter the baseball stadium together?
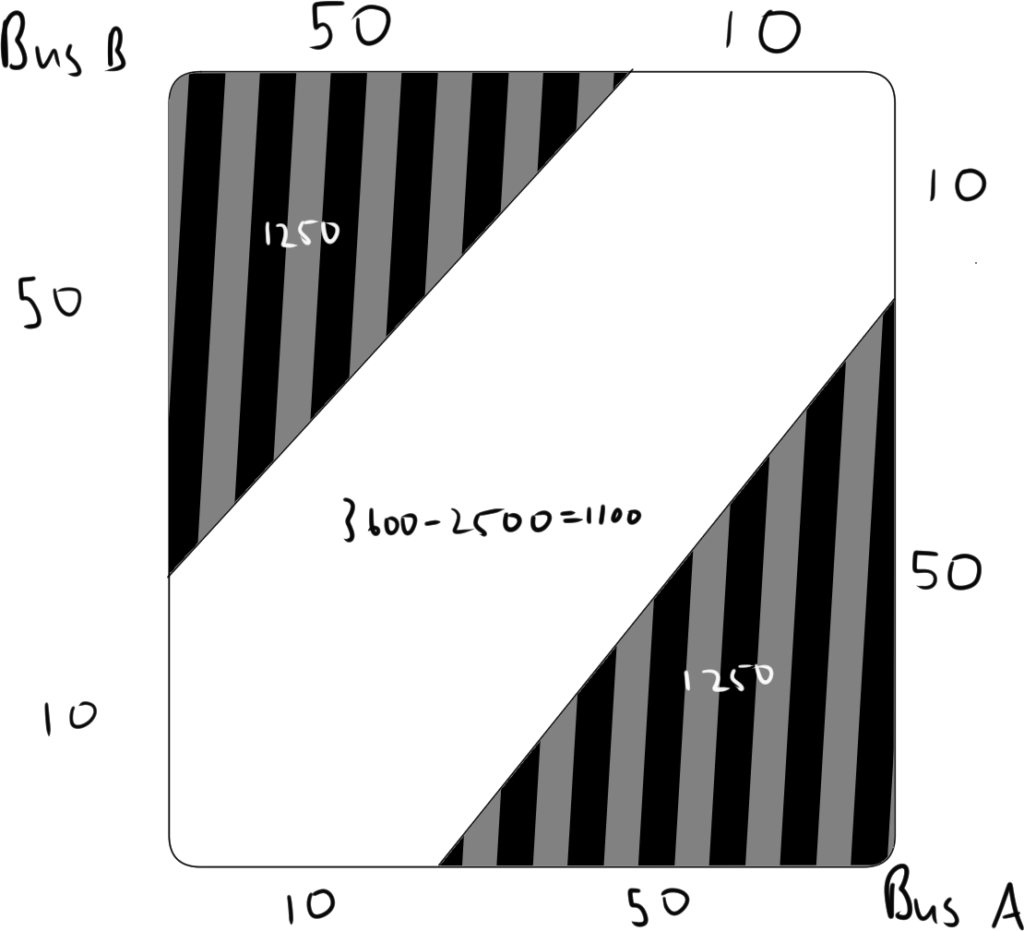
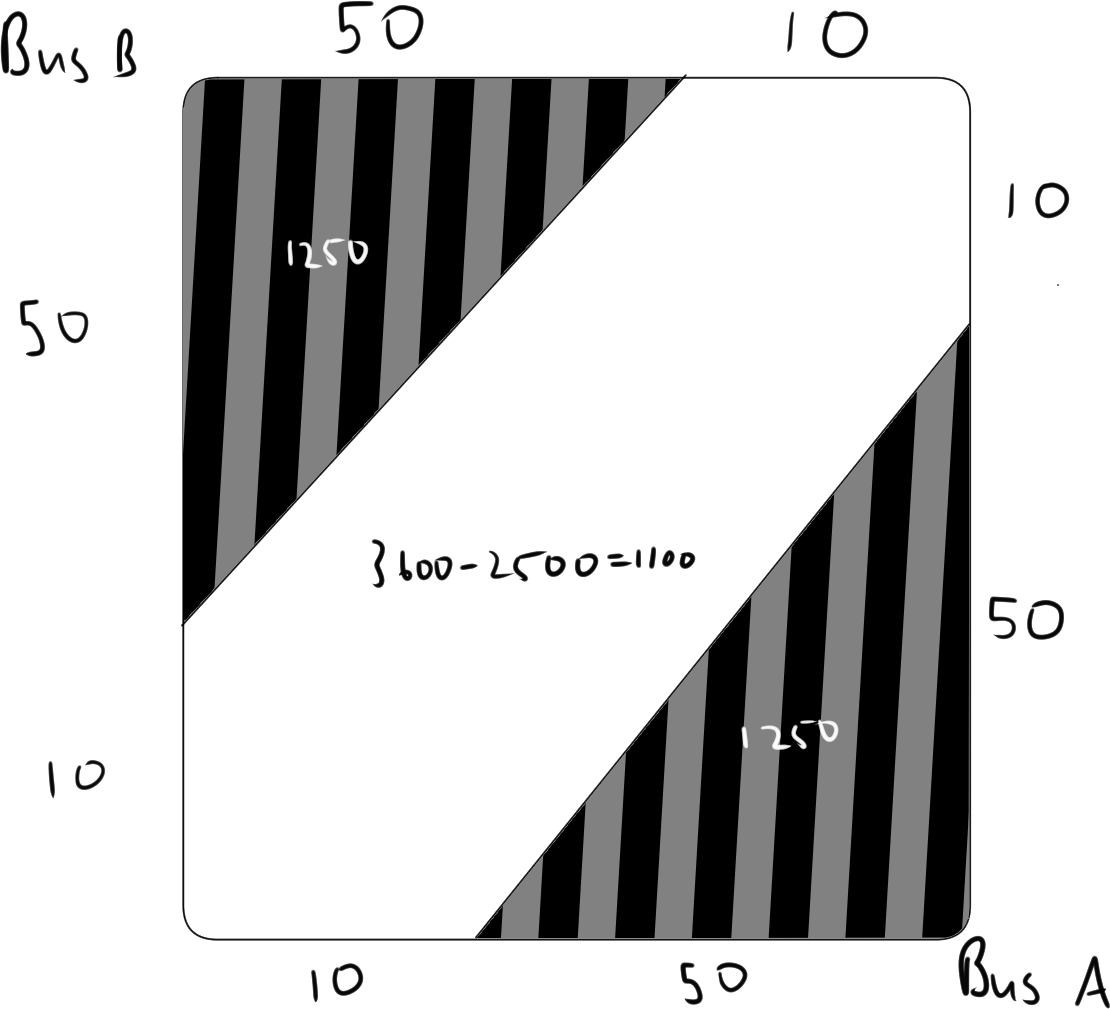
Using the fact that probability is the select outcomes divided by the total outcomes doesn’t work so well. Instead, we can use graphs to try to comprehend what is happening. One axis will represent your bus, and the other axis your friend’s bus. For the sake of simplicity, we will call the buses Bus A and Bus B and determine their value using the number of minutes after 5:00 pm. Thus, we can model the overlap between buses through lines—the two lines where bus A arrives 10 minutes before or after Bus B. Here is each inequality represented algebraically:
Bus A < Bus B + 10 which simplifies to y > x – 10 and Bus B < Bus A + 10 which simplifies to y < x + 10)
The result is that certain regions represent scenarios in which the buses fail to overlap at the bus stop. This region consists of two 50×50 triangles which combine to make an area of 2500. The total grid covers a 60×60 square of area 3600, making the final probability 25/36 that the friends miss each other (See Figure 2).

The use of geometric probability in essence, uses graphs to model chance and provides a method to actually calculate that chance. Geometric probability can also be applied to a three-dimensional figure to solve a three-dimensional problem. Add another bus, and we create an octahedron: a nice three-dimensional figure. This further complicated problem still uses our original method by finding the volume of desired probability over the volume of the total probability and demonstrates the astonishing fact that the same fundamental concepts apply at higher degrees of mathematics.
– Charlie Chen
References
- Khan Academy.Probability, the basics. Retrieved September 29, 2020 from https://www.khanacademy.org/math/statistics-probability/probability-library/basic-theoretical-probability/a/probability-the-basics
- Geometric Probability. Brilliant.org. Retrieved 15:29, October 12, 2020 from (https://brilliant.org/wiki/1-dimensional-geometric-probability/#:~:text=Geometric%20probability%20is%20a%20tool,probability%20by%20outcomes%20for%20more).
Images
- https://help.floodfactor.com/hc/article_attachments/360070751574/coin_flip_2.png
- https://lh3.googleusercontent.com/mZ42KoNAGIL8Xp93UtdAvkxo3mU7AeCgJ7sEJAxS8YjxsA8-dBLvl34ZM9HeaIxbiB5HwqiuD0-no7NNsptOHs9g409SPRgzP_qaDjvM69Q7TckXe4Gd7PT8DkFrUGFYTOK8laMa


Comments are closed.